
URBED Intelligence: Oxford
Where should Oxfordshire's next homes go?
The UK is stuck on where to build. Everyone has a view, and few can see what each choice gives up.
This is a thought experiment, based on Oxfordshire, to help people consider the options: choose what matters to you, place the homes, and test scenarios for the future on open data.
A working prototype, in development.
How it works
You work through four steps, and the map redraws as you go. The pictures here are simplified: in the tool, each hexagon is 250 metres across.
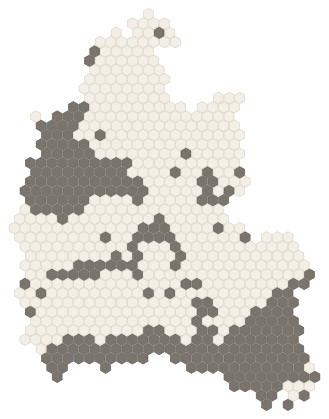 ConstraintsWhat should limit where new homes go: flood risk, green belt, wildlife, heritage.
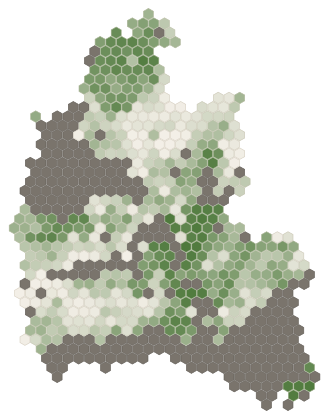 AttractorsWhat makes land a good place for new homes: near a station, a good bus, jobs in reach.
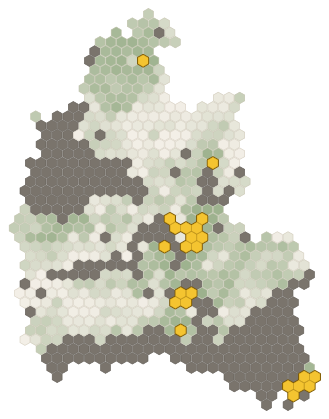 AllocationHow many homes, and in what pattern: the highest scoring land, extensions, new settlements or corridors.
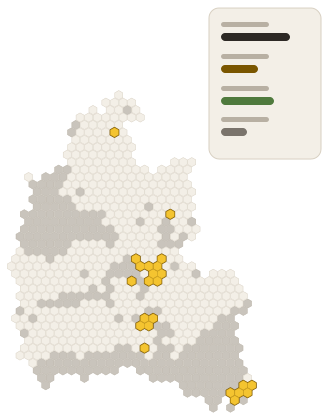 SummaryWhat your choices add up to, to save, compare and share.
Four ways to look at the options, or your own
Four starting points, each weighing what matters differently. Each of the four pictures shows where that way would put the homes, in gold, for a target of 26,505: five years' worth under the government's standard method. They show how the choices work, not what should happen.
-
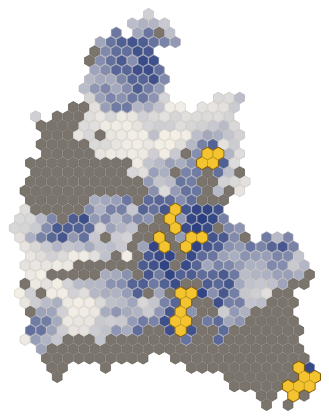 EconomyLeans towards the railway and the jobsHomes by the stations and the jobs, then where skills, land values and spare power are.
-
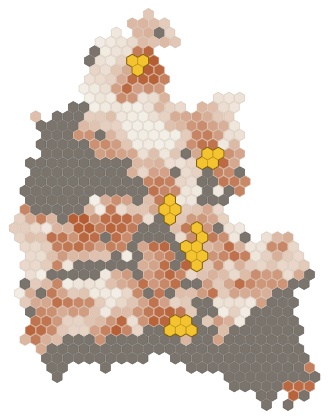 EquityLeans towards the places that need it mostHomes first where they would lift the most deprived places, near a bus or a train.
-
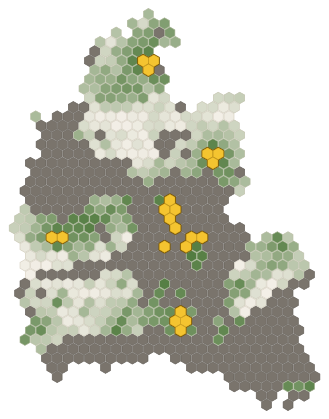 EnvironmentLeans towards protecting the countrysideGreen belt and National Landscapes out of play; land already built on first; farmland and wildlife count against a site.
-
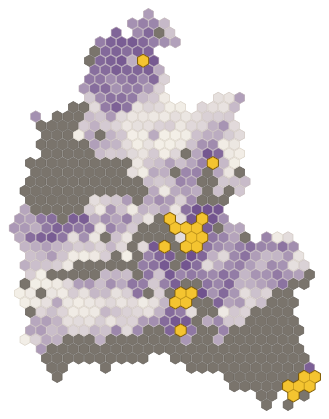 BalancedA bit of eachEvery good reason for a place counts the same, from stations and jobs to deprivation and spare power.
-
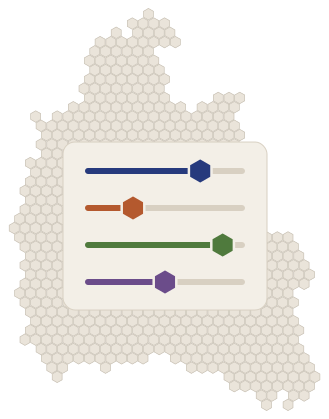 Your ownSet it all yourselfChange any of the four, or begin from a blank map: the constraints, how much each reason counts, how many homes, the pattern.
- Ruled out by the constraints
- Darker land scores higher
- Where the homes go
See it in use
Built on 36 layers of open data, each named and dated in the tool with its source and licence.